In this article, I will walk you through integrating Azure Application Insights with a Microsoft Copilot Studio custom agent. By the end, you will be able to capture telemetry data from your agent conversations and query it using Kusto Query Language (KQL) in the Azure portal.
What is Application Insights?
- Application Insights is a feature of Azure Monitor that provides Application Performance Management (APM) capabilities
- It helps you monitor live applications by tracking logged messages, events, and custom telemetry
- When connected to a Copilot Studio agent, it captures conversation telemetry including topic triggers, message events, and generative AI responses
- You can query and analyze this data using Kusto Query Language (KQL) in the Azure portal
Why Application Insights with Copilot Studio?
If you’re building a custom agent in Copilot Studio, the built-in Analytics tab gives you a basic view of conversation sessions and engagement. But when you need deeper insights — like tracking which topics are being triggered, how long generative answers take, or what errors are occurring — Application Insights gives you the full picture with powerful KQL queries.
Prerequisites
- An active Azure subscription (e.g., Visual Studio Enterprise, Pay-As-You-Go)
- A Microsoft Copilot Studio custom agent (I’m using the “Website Q&A” agent in this walkthrough)
Now that you know the basics and have the prerequisites in place, let’s get started with creating the Application Insights resource.
Create an Application Insights Resource in Azure
- Navigate to the Azure portal and search for Application Insights
- You will see the Application Insights page. Click + Create to create a new resource

- Fill in the creation form with the following details:
| Setting | Value |
|---|---|
| Subscription | Your Azure subscription |
| Resource Group | Create new (e.g., rg-appinsights) |
| Name | A descriptive name (e.g., CopilotAgentsInsights) |
| Region | A region close to you (e.g., (US) East US) |
| Log Analytics Workspace | Use default or create new |
- Click Review + create and then Create

- Give it sometime to complete the provision of App Insights resource.
- Once the resource is created, navigate to its Overview page
- Copy the Connection string which we will need in the next section.
- Click the Copy to clipboard button to copy it

🎯 Important: Copy the Connection string, not the Instrumentation Key. Microsoft recommends using the Connection string for all new integrations.
We now have the Application Insights resource created and the Connection string copied. Let’s head over to Copilot Studio to connect our agent.
Configure Application Insights in Copilot Studio
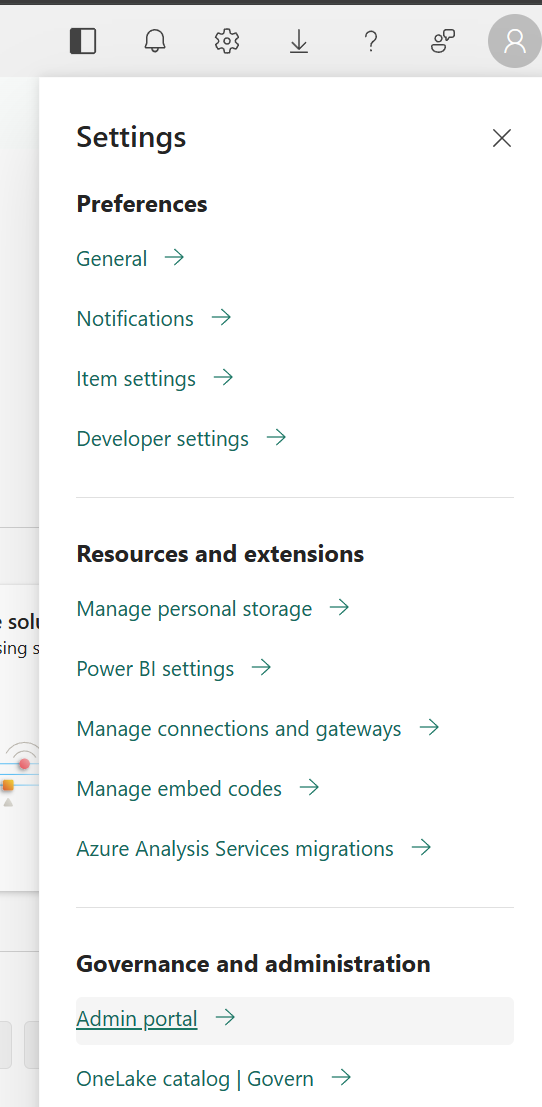
- Open your agent in Copilot Studio and click the Settings button in the top-right corner.

- In the Settings panel, select Advanced from the left navigation
- You will see the Application Insights section with the Connection string field and advanced options

- Paste the Connection string you copied from the Azure portal
- Configure the Advanced options based on your needs:
| Setting | Recommended | Description |
|---|---|---|
| Enable logging | ON | Logs details of incoming and outgoing messages and events |
| Log conversation details | ON | Logs conversation-level details |
| Log sensitive properties | OFF (default) | When ON, logs userid, name, text, and speak properties. Enable only if you need to see actual message content |
| Node execution events | ON | Logs topic node execution details |
- Click Save

With the Connection string configured and logging options set, we need to publish the agent for the changes to take effect.
Publish and Test the Agent
- Click the Publish button in the top-right corner of Copilot Studio
- Wait for the publishing process to complete

- Once published, let’s test the agent to generate some telemetry data.
- Open the Test your agent panel on the right side
- Send a message to the agent. I asked: “Explain about ‘Application Insights’ and ‘Copilot Studio Agent’ integration”
- The agent responds with a detailed answer based on its knowledge sources

Now let’s head over to Application Insights to verify the telemetry data is flowing.
We have the agent published and tested with a sample conversation. Now let’s go back to the Azure portal and verify that the telemetry data is actually flowing.
Verify Telemetry in Application Insights
- Go back to your Application Insights resource in the Azure portal
- Navigate to Monitoring > Metrics
- Set the Metric to Users with Unique aggregation
- You should see at least 1 unique user captured from your test conversation

The Metrics view confirms telemetry is flowing. But the real power of Application Insights is in querying your data using Kusto Query Language (KQL). Let’s explore that next.
Query Telemetry Data with KQL
- Navigate to Monitoring > Logs in your Application Insights resource
- Enter the following KQL query to see test pane conversations with message text:
customEvents | extend text = customDimensions['text'], fromName = customDimensions['fromName'], designMode = customDimensions['DesignMode'] | where designMode == "True" | project timestamp, name, text, fromName | order by timestamp asc
- Click Run to execute the query

The results show the full lifecycle of the conversation:
| Event Name | Description |
|---|---|
BotMessageReceived | The user’s message was received by the agent |
TopicStart | A topic was triggered |
TopicAction | Actions within the topic are executing (e.g., search-content) |
GenerativeAnswers | The agent generated an AI-powered response |
BotMessageSend | The agent sent its response back to the user |
TopicEnd | The topic flow completed |
Useful KQL Queries
Here are some additional queries you can use:
- Exclude test conversations (show only production data):
customEvents| extend isDesignMode = customDimensions['DesignMode']| where isDesignMode == "False"
- Count unique users per day over the last 14 days:
let queryStartDate = ago(14d);let queryEndDate = now();let groupByInterval = 1d;customEvents| where timestamp > queryStartDate| where timestamp < queryEndDate| summarize uc=dcount(user_Id) by bin(timestamp, groupByInterval)| render timechart
- View generative answer events with sources:
customEvents| where name == "GenerativeAnswers"| extend cd = todynamic(customDimensions)| project timestamp, Sources = cd['Sources'], Result = cd['Result']| order by timestamp desc
That covers the full integration — from setting up the resource all the way to querying conversation-level telemetry.
The key takeaways are:
- Application Insights captures all conversation telemetry including test pane and published channel interactions
- Use the Connection string (not the legacy Instrumentation Key) for configuration
- The “Log sensitive properties” toggle controls whether actual message text is captured — keep it off for privacy unless debugging
- Use the
DesignModecustom dimension (PascalCase) to filter between test and production conversations - KQL queries give you powerful insights into topic triggers, generative answers, errors, and user activity
For more details, refer to the official Microsoft documentation: Capture telemetry with Application Insights
🙂

Leave a Reply