With the Power Platform admin center, you can export Power Platform inventory and usage data directly into Azure Data Lake Storage for advanced analytics and reporting.
In this article, I’ll walk you through how to export the Power Apps inventory data into Azure Data Lake Storage and then use Power BI to build a simple report that visualizes app usage.

Lets get started with basics and prerequisites:
What is Azure Data Lake Storage (ADLS):
- Azure Data Lake Storage is a set of capabilities dedicated to big data analytics, built on Azure Blob Storage.
- When integrated with Power Platform, it allows organizations to export Power Apps and Power Automate inventory and usage data, such as environments, apps, makers, flows, and their activities into a central data lake.
- A Data lake is just a storage place in the cloud where Power Apps saves data like apps, users, and environments, so you can analyze it later using tools like Power BI.
Prerequisites
- To access data export in the Power Platform admin center, you must have one of these roles: Power Platform admin, Dynamics 365 admin, or Microsoft 365 Global admin.
- Create a storage account to use with Azure Data Lake Storage Gen2. Make sure you select the same location for the Data Lake Storage account as your Power BI tenant.
Create a Azure Data Lake Storage account:
To use Data Lake Storage capabilities, we need to create a storage account that has a hierarchical namespace.
- Connect to Azure Portal and search for Storage Accounts.

- Click on Create storage account

- In the Create a storage account screen
- Resource Group : Create a new or choose existing
- Primary service : Azure Blog Storage or Azure Data Lake Storage Gen 2
- Performance : Standard
- Redundancy : I chose Locally-redundant storage (LRS) for cost-effectiveness. You can choose a different option based on your requirements.

- Click Next
- In the Advanced tab,
- Hierarchical Namespace: Enable hierarchical namespace must be selected.
- Security: Require secure transfer for REST API operations must be selected.
- Click Next

- In the Networking tab,
- Network Connectivity, Network Access: Enable public access from all networks must be selected.
- Network Routing, Routing Preference: Microsoft network routing is recommended.

- Click on Review + create unless you have any specific Data Protection and Encryption requirements.
- Click on Create to complete the creation.

- Give it few minutes to complete the provisioning.
- Click on Go to resource

- You will see the storage account stgppdataexportt, with details.

Now that the storage account is created, we can proceed with configuring Data Export in the Power Platform Admin Center.
Configure ‘Data export’:
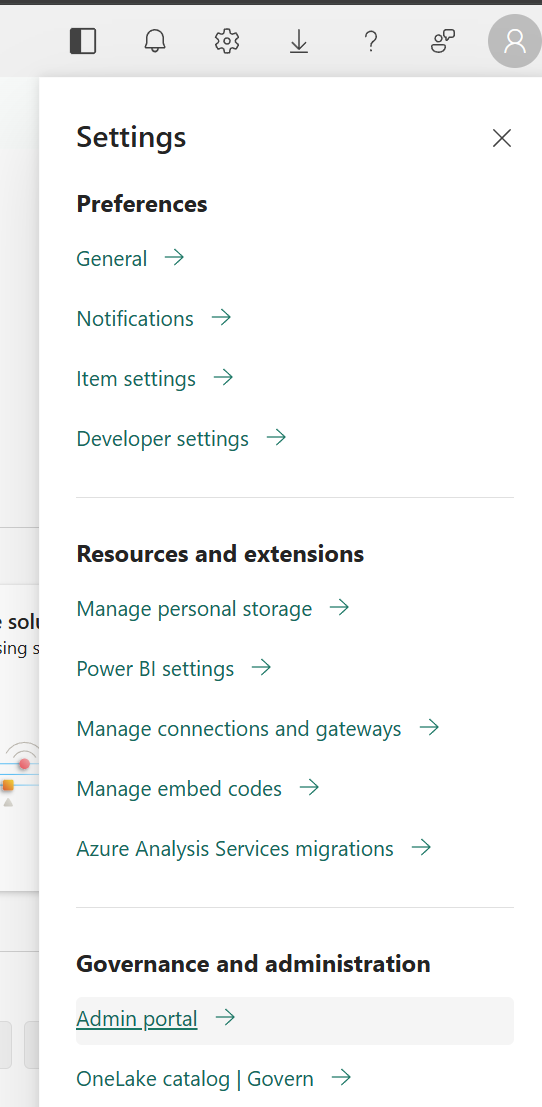
- Navigate the Power Platform Admin Center (PPAC).
- On the left pane, select Data Export.

- Under the Data Lake (Preview) tab, click on + New data export
- In the Export to Azure Data Lake, choose either Power Apps or Power Automate as per your requirement.
- Turn on Enable tenant-level analytics

- Click Next
- In the Subscription tab, choose the Azure Data Lake Storage account created in previous section.

- Click Create to complete the configuration.

- The Data Export initially appears with a Pending status. In my case, it took approximately 10 hours to complete the configuration.

- Once the status changes to Connected.

- In the Azure portal, a new blob container named
powerplatformis created in the Azure Storage account. - Navigate to the Storage browser in the Azure portal to view the container and its contents.

- Below is an example of how the
powerplatformcontainer appears in Azure Storage.

Data structure of the Data export:
When you export Power Apps and Power Automate inventory and usage data to your Data Lake Storage, self-service analytics makes the data available in a Common Data Model schema format.
The root folder for Power Apps includes subfolders based on the components available in the environment. These typically include:
- \Applications
- \ConnectionReference
- \Connections
- \Environments
- \Usage

- Click on one of the folders and you will find the .json files.

- If you download one of the
.jsonfiles (e.g., from theUsagefolder), the data inside looks similar to the following:

We have successfully enabled the Data Export feature to send Power Platform data to Azure Data Lake Storage. Next, we will walk through how to connect to the exported data and build a simple Power BI report.
Visualizing Power Apps Data Export in Power BI:
Step 1: Get the Azure Data Lake Storage URL
To begin, get the Data Lake Storage URL from the Azure Storage Account.
- Sign in to the Azure portal.
- Go to the storage account configured to receive Data Export data.
- Select Endpoints.
- Find and copy the Data Lake Storage URL.
- At the end of the URL, add
/powerplatformto form the complete path.- Example:
https://<your-storage-account>.dfs.core.windows.net/powerplatform
- Example:
- Save this URL. We will use it in Power BI to connect to the data.

Step 2: Connect Power BI to Azure Data Lake Storage Gen2
Now that we have the storage URL, we can use Power BI Desktop to connect to the data.
Follow these steps:
- Open Power BI Desktop on your machine.
- From the Home tab, click on Get Data.
- In the list of data sources, search for and select Azure Data Lake Storage Gen2 (Beta).
- Click Connect.

- When prompted, paste the URL you copied in Step 1 (including
/powerplatformat the end). - Click OK.

- If you encounter the following error when trying to connect : Access to the resource is forbidden

- You likely do not have permission to read data from the storage account. Follow these steps to fix it:
- Navigate to Azure Portal > Storage Account > Access Control (IAM)
- Click the Role assignments tab.
- Click + Add > Add role assignment.
- Under Role tab, choose Storage Blob Data Reader role as shown below

- Under Members, add your user account (the one you’re using in Power BI).

- Return to Power BI Desktop.
- Try reconnecting, you should now see the folder structure (e.g.,
powerapps,usage,dataverse, etc.).

Step 3: Transform JSON Data in Power Query Editor
Once you’ve successfully connected to your Azure Data Lake, click on Transform Data to open the Power Query Editor.
- You will be redirected to Power Query Editor as shown below.

- In this article, I will focus on the App Usage data, so we’ll start by filtering only the
AppUsage*.jsonfiles.

- Power Query Editor looks as below with AppUsage.json files. You will now see a list of records where the Content column is of type Binary.

- As a next step, convert Binary to Text format, by following below steps:
- Click on Add Column > Custom Column
- Under Custom column formula provide Text.FromBinary([Content])
- Provide column name as JsonText
- Click OK

- You should now see a new column named
JsonText.

- Now let’s clean the JSON so it can be parsed.
- Create another custom column named RawJson with the following formula: Text.From([jsonText])

- You’ll notice that each cell in the
RawJsoncolumn contains multiple JSON lines. - So we need to split the data as shown below:
- Select RawJson column
- Choose Split Column > By Delimiter

- Choose following options and click OK

- This will transform the multiline text into individual rows.

- Next we need to remove blank rows and then apply Group By.
- To simplify this steps, let me share you the formula. Follow below steps:
- Go to Home >Advanced Editor

- Override the existing formula with the following:
let
    Source = AzureStorage.DataLake("https://stgppdataexportt.dfs.core.windows.net/powerplatform"),
    #"Filtered Rows" = Table.SelectRows(Source, each ([Extension] = ".json")),
    ShowOnlyAppUsage = Table.SelectRows(#"Filtered Rows", each ([Name] = "AppUsage2025-04-21.json" or [Name] = "AppUsage2025-04-22.json" or [Name] = "AppUsage2025-04-24.json" or [Name] = "AppUsage2025-04-25.json" or [Name] = "AppUsage2025-04-28.json")),
    #"Added Custom" = Table.AddColumn(ShowOnlyAppUsage, "JsonText", each Text.FromBinary([Content])),
    #"Reordered Columns" = Table.ReorderColumns(#"Added Custom",{"Content", "JsonText", "Name", "Extension", "Date accessed", "Date modified", "Date created", "Attributes", "Folder Path"}),
    #"Added Custom1" = Table.AddColumn(#"Reordered Columns", "CleanJson", each Text.From([JsonText])),
    #"Renamed Columns" = Table.RenameColumns(#"Added Custom1",{{"CleanJson", "RawJson"}}),
    #"Split Column by Delimiter" = Table.ExpandListColumn(Table.TransformColumns(#"Renamed Columns", {{"RawJson", Splitter.SplitTextByDelimiter("#(lf)", QuoteStyle.None), let itemType = (type nullable text) meta [Serialized.Text = true] in type {itemType}}}), "RawJson"),
    #"Changed Type" = Table.TransformColumnTypes(#"Split Column by Delimiter",{{"RawJson", type text}}),
    #"Removed Blank Lines" = Table.SelectRows(#"Changed Type", each Text.Trim([RawJson]) <> ""),
    #"Parsed JSON" = Table.TransformColumns(#"Removed Blank Lines",{{"RawJson", Json.Document}}),
    #"Expanded RawJson" = Table.ExpandRecordColumn(#"Parsed JSON", "RawJson", {"appId"}, {"RawJson.appId"}),
    #"Filtered AppId" = Table.SelectRows(#"Expanded RawJson", each [RawJson.appId] <> null and Text.Trim([RawJson.appId]) <> ""),
    #"Grouped by AppId" = Table.Group(#"Filtered AppId", {"RawJson.appId"}, {{"LaunchCount", each Table.RowCount(_), Int64.Type}})
in
    #"Grouped by AppId"

- Click on Done
- You get data as below

- Then click Close & Apply to load the data back into Power BI and you’ll be redirected to the Power BI Report Designer

- Add a Clustered Column Chart
- Drag
RawJson.appIdto the X-axis. - Drag
LaunchCountto the Y-axis.
- Drag

- That’s how we can build sample charts with the data.
Hope you got an understanding of the basics of exporting Power Platform data using the Data Export feature and building reports in Power BI.
Refer Power Platform Data Export: Track Cloud Flow Usage with Azure Application Insights article Data Export using Application Insights.
🙂

Leave a Reply