Recently while troubleshooting as issue which was only occurring for a particular user, there was this question from a customer on “Determining how this user is accessing their system”.
To simplify the question, assume that you have a Model Driven App and end users might access it from following modes and you need to determine using which mode a particular User accessed the application in last 24 hours.
- Different browsers
- Plug-in Registration
- XRMToolBox
- Powerautomate
- Postman
- etc…
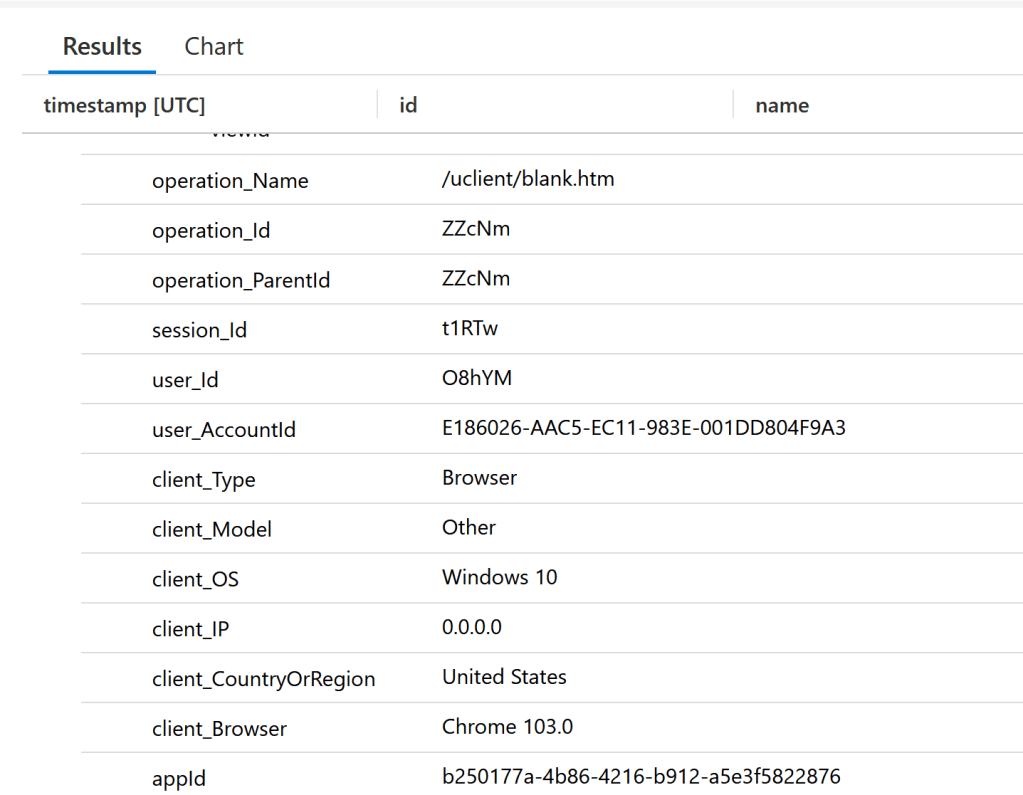
Coming back to troubleshooting, since the issue occurring for only a User, it would be a great help to fetch User access details like (Client OS, Region, Host Type, User Agent etc…) to narrow down the issue and provide fix.
In this article lets see how Application Insights telemetry data helps us troubleshoot issues related to application slowness, intermittent issues and many more.
Prerequisites:
- Azure subscription and a ‘Application Insight’ environment. Get your free Azure subscription here.
- A Power Platform environment with Dataverse database
Once the prerequisites are fulfilled, we need to set up Applications Insights for Power Platform environment.
Configure Application Insights for Power Platform Environment:
- Set up export to your Applications Insights environment from the Power Platform admin center. Steps mentioned here.
- Typically, one production environment or tenant maps to one Application Insights environment.
- Post data export connection set up. Data will start being exported to your Application Insights environment, In the next 24 hours,.
Access the Application Insights Telemetry Data:
To access the Application Insights data
- Connect to your Azure Portal.
- Open the ‘Application Insights’ environment which you mapped to your Power Platform environment in the above section.
- Under Monitor -> Logs, Run the Kusto queries.
Before jump on executing the queries, I highly recommend you to go through Telemetry-events-model-driven-apps and Telemetry-events-dataverse.
pageViews table
- Application Insights page load data goes into the pageViews table.
- We need to query pageViews table to fetch the Page load/User access related data.
- Below is a sample query to pageViews table.

How to fetch the user access details.
- To determine how the user is accessing the system, The userAgent attribute in the customDimensions field in the Application Insights pageViews table has this data.
- Use the following query to get an overview of the different sources from where users are accessing the system:
pageViews
| summarize count() by tostring(customDimensions.userAgent), user_Id

dependencies
| where ['type'] == "UCI REQUEST"
Using the ‘Session ID’ to troubleshoot slowness or load issues:
- Users can share their session ID from the About section of the App.


- You can then use this ID to find issues by looking at all the activities in that session. Use the following query:
union *
| where session_Id == '[sessionIdHere]'
🙂


Leave a comment