There’s a new way to visualize your model-driven Power Apps and Dynamics 365 data stored within Dataverse. With a single click, Power BI will automatically generate a set of visuals for you to explore and find insights within your data.

Prerequisites:
Enable Model Driven App Level Setting:
- This feature is App specific, so select the Model Driven App and choose ‘Edit in preview’ option.

- Go to Settings -> Features and enable “Enable Power BI quick report visualization on a table (preview)” option.

Enable Environment Level Setting:
- Connect to Admin Center and select the ‘Environment’.
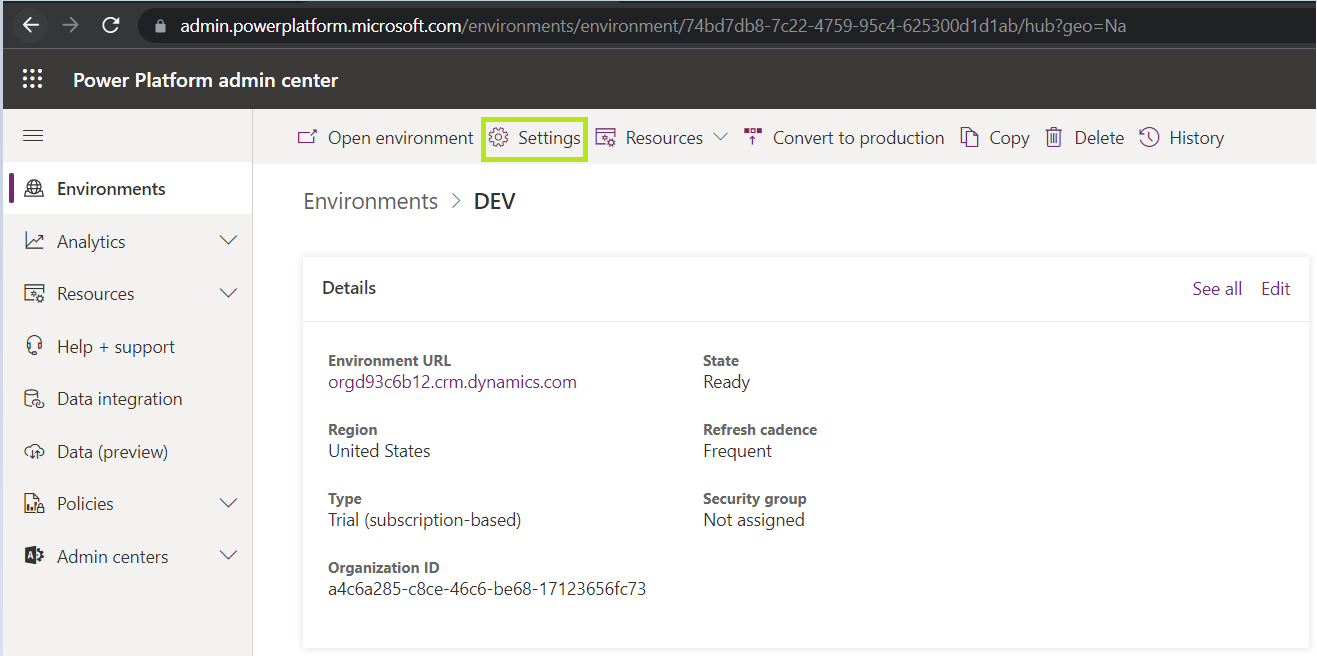
- Go to Settings -> Product -> Features
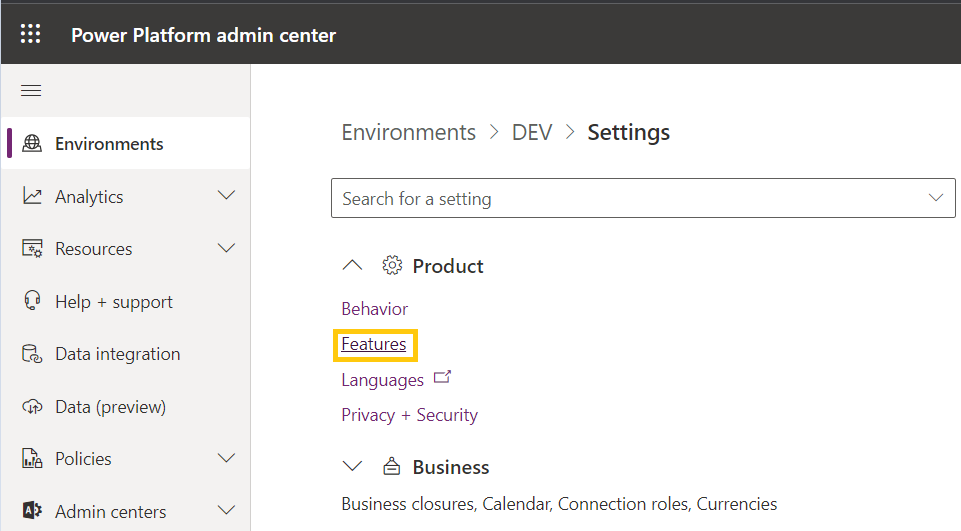
- Enable ‘TDS endpoint’ feature.

Power BI License:
- Make sure you have Power BI license.
- If you dont have a license, ‘Visualize this view’ shows following screen.
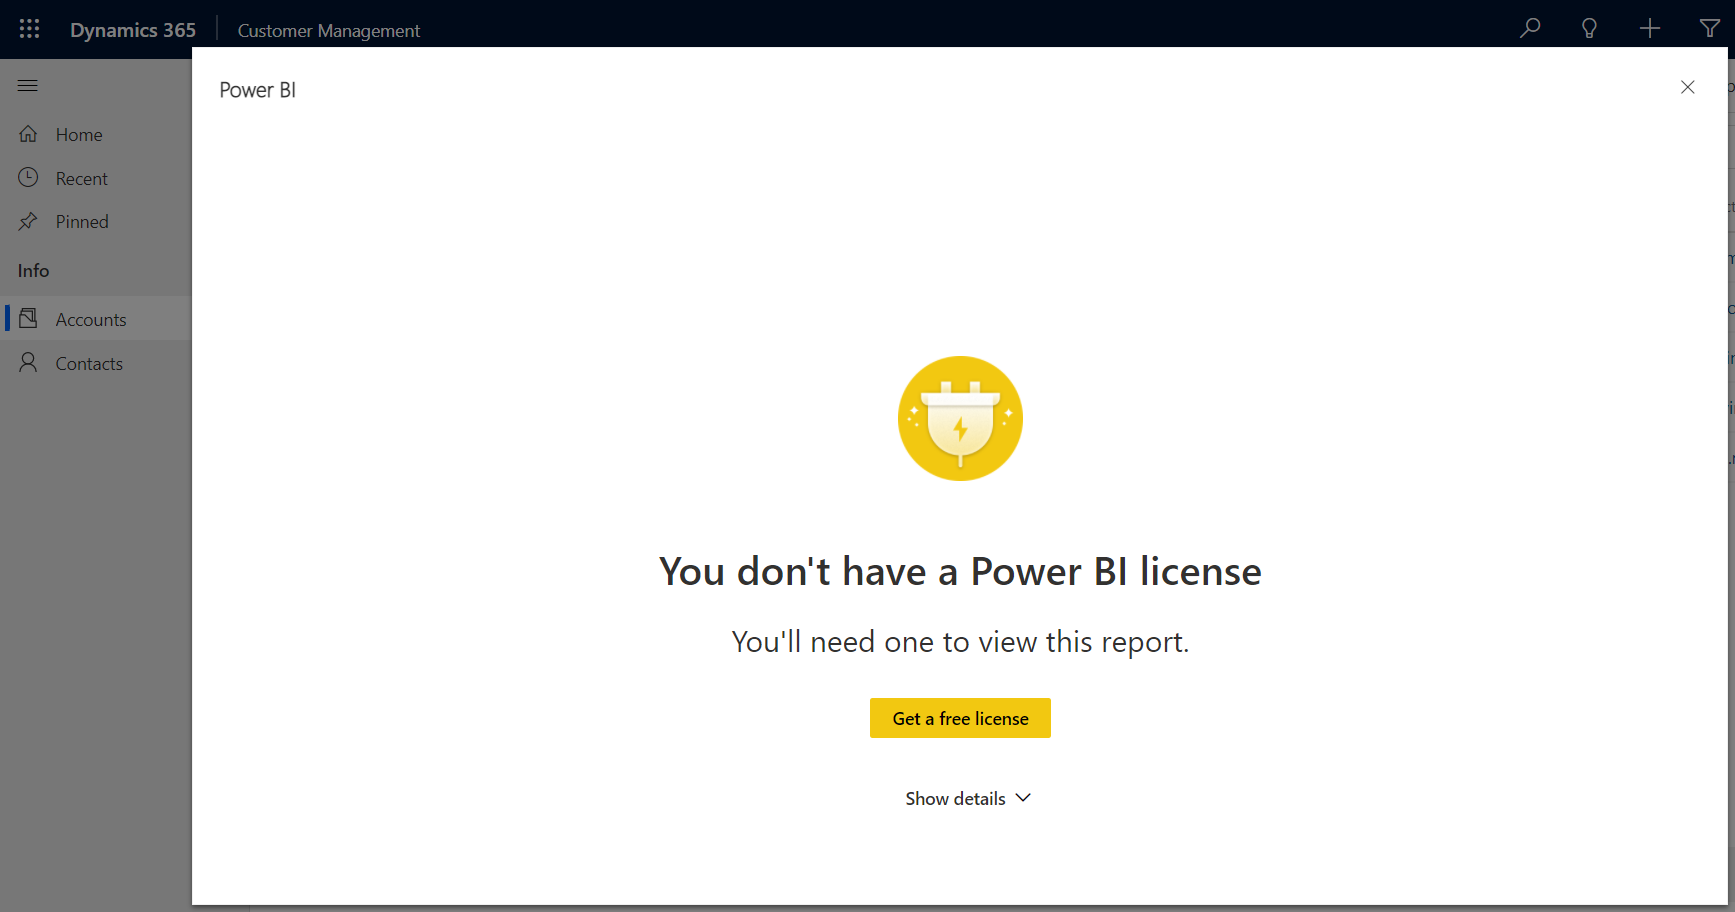
- Acquire license and retry.
Using ‘Visualize this view’ option:
- Open the Model Driven App.
- Select any view and click on ‘Visualize this view’ button from Ribbon.
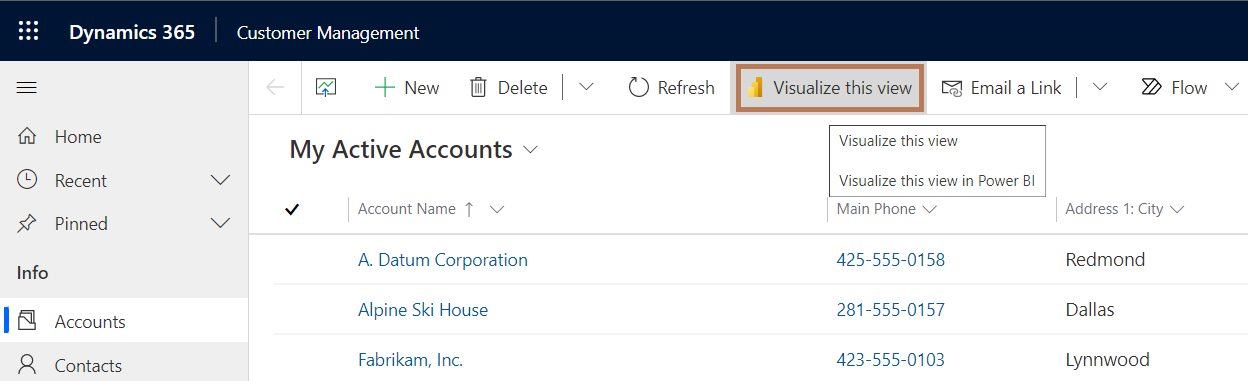
- It will open up, Power BI report screen.

Key Notes:
- The data being visualized within the report is always based on the data currently in the view’s grid.
- This means if you’ve applied any filters to the grid, that filtered data will be used in the Power BI visuals. For example, if the view is filtered down to just 15 rows of data, only 15 rows will be visualized through Power BI.
- At the time of writing this article, the visuals generated from this flow can only be used for personal exploration. You can’t share or save them.
- Column display names aren’t used within the report. You’ll see the system names in the resulting visuals.
- You may notice more columns within the report than you see in the original view. These fields could include foreign keys for the columns or hierarchy, or URL fields that are being used within the original view for purposes other than columns.
- The report created through this feature is temporary, so the experience times out after a set amount of time. At that point you need to close and reopen the report to continue exploring your data. For now, the timeout occurs at one hour.
Refer this docs link for more details.
🙂


Leave a comment